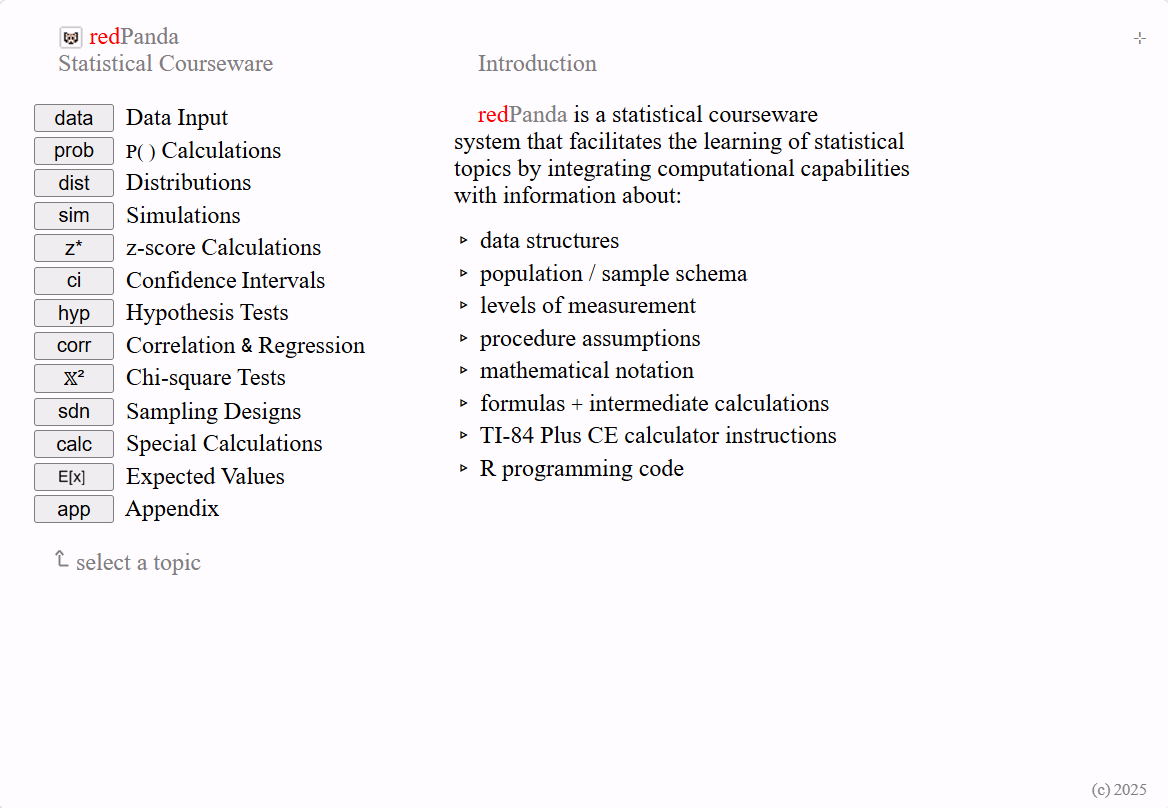
From there, the user can click any of the topic buttons located in the gray panel on the left side of the screen to reveal the corresponding topic submenus.
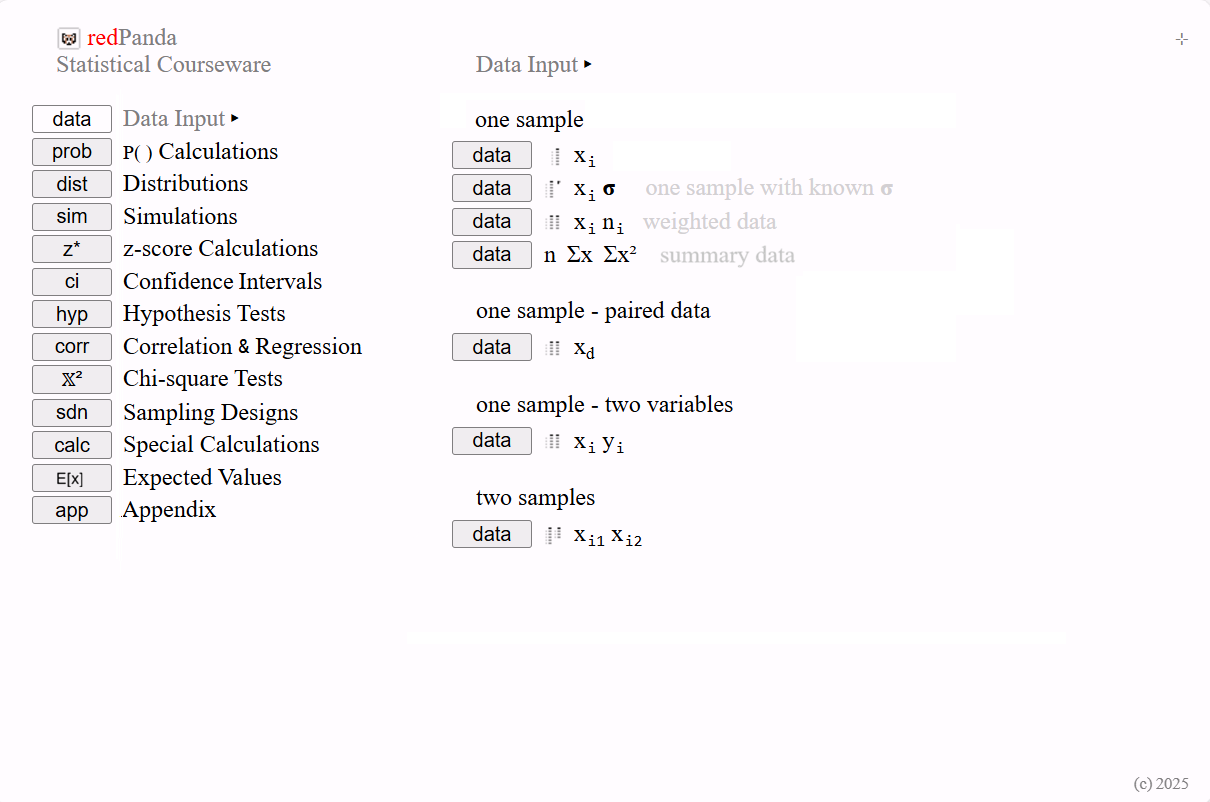
The data procedures require students to associate specific data structures with the types of analyses they support.
In this section, the procedures focus on entering ratio and interval data for one‑sample and two‑sample datasets. This serves as a common starting point in many introductory statistics courses.
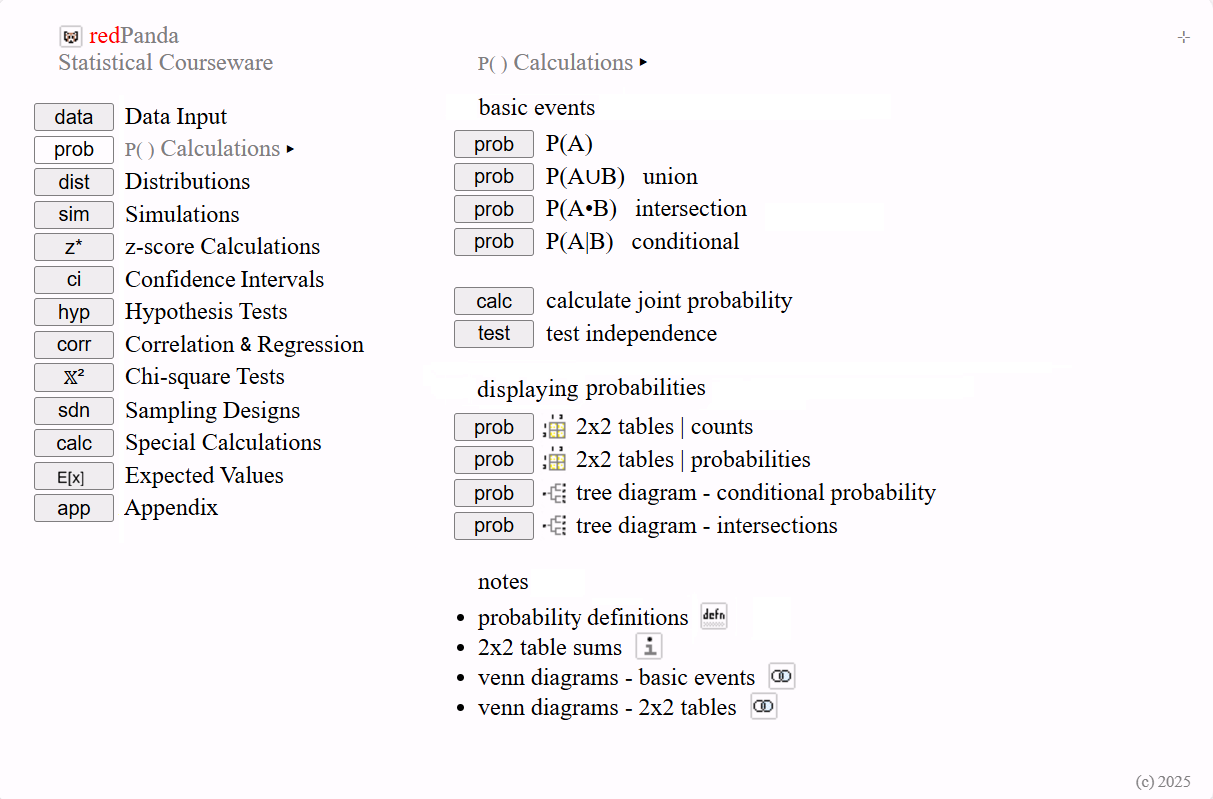
The probability procedures provide students with a set of tools for working with probability operators, 2×2 tables, tree diagrams, and Venn diagrams.
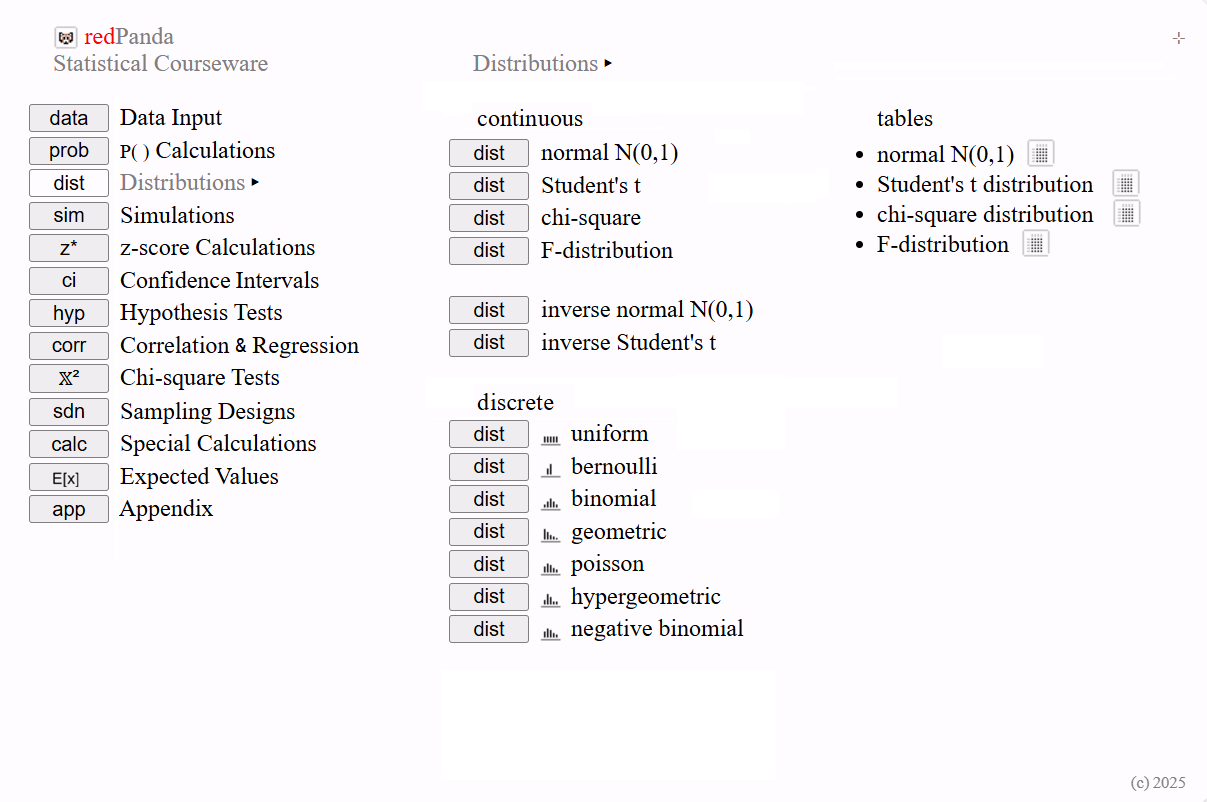
All common discrete and continuous probability distributions are accessible from this submenu.
Additionally, several reference tables are provided, giving students the opportunity to practice manually looking up probability values.
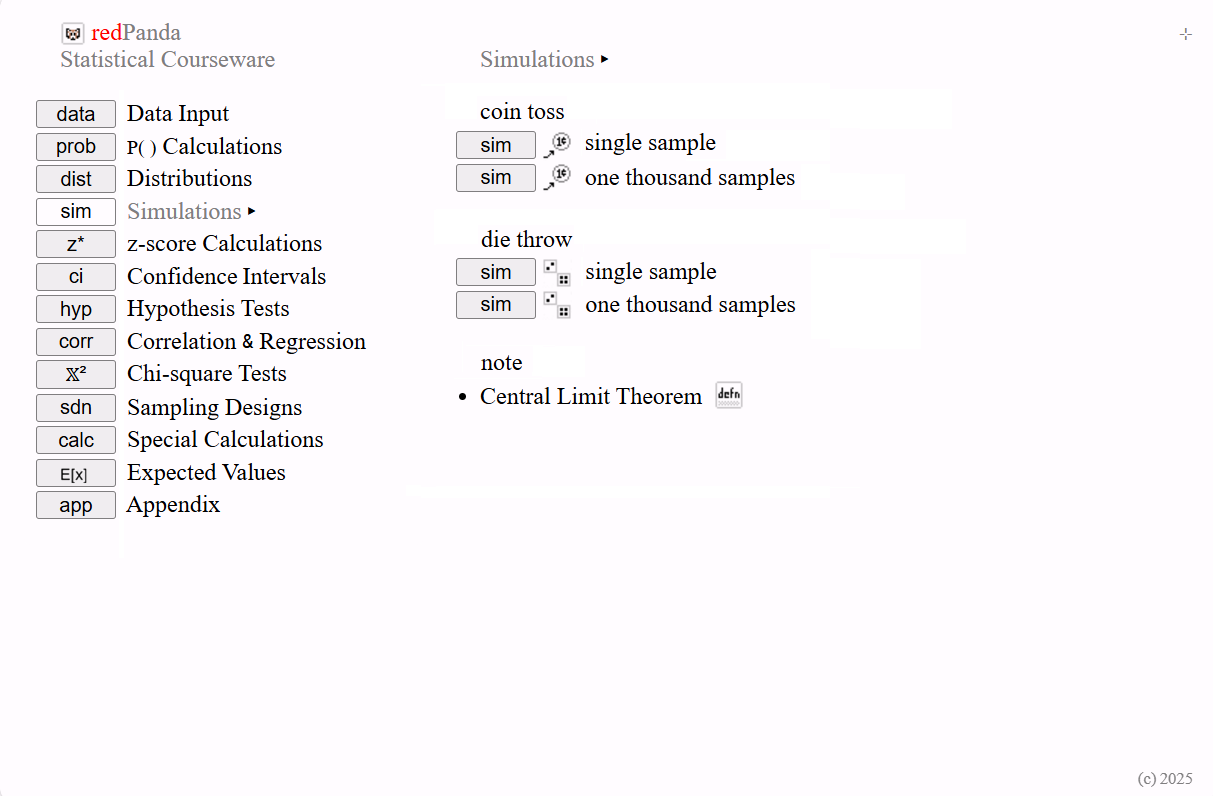
Two basic simulation scenarios are provided to give students a hands‑on understanding of the relationship between sample statistics and population parameters. Recognizing this distinction is essential for developing a solid grasp of the Central Limit Theorem.
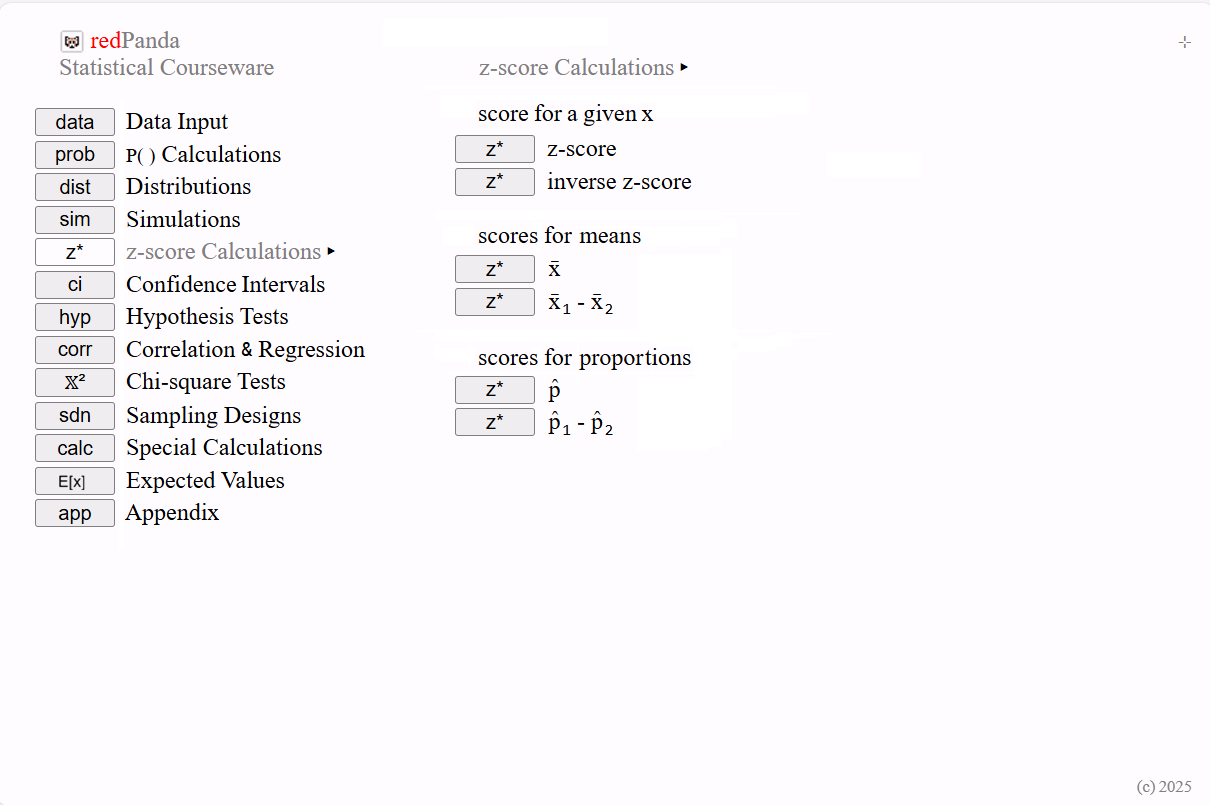
These procedures offer computational tools for working with z‑scores for individual values, sample means, and proportions.
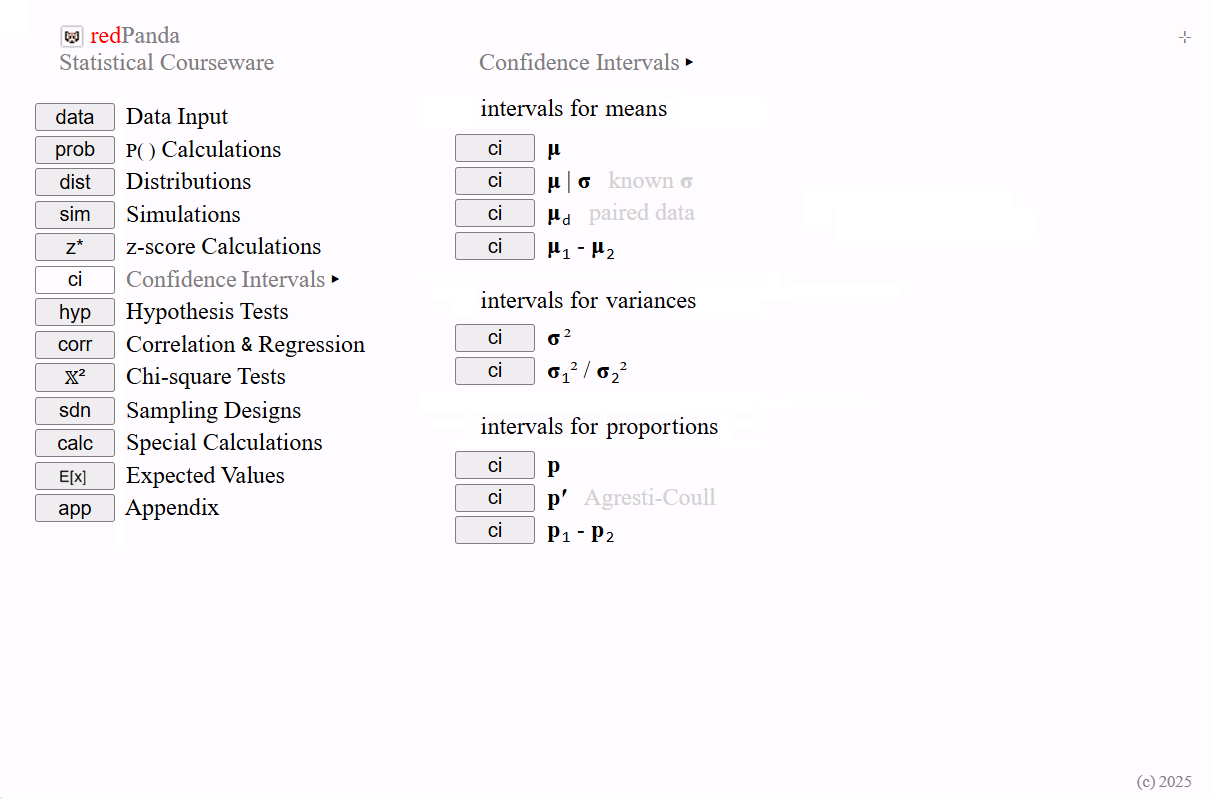
All common parametric confidence intervals are included within this submenu.
This topic serves as the starting point for students to begin working with and understanding statistical tests.
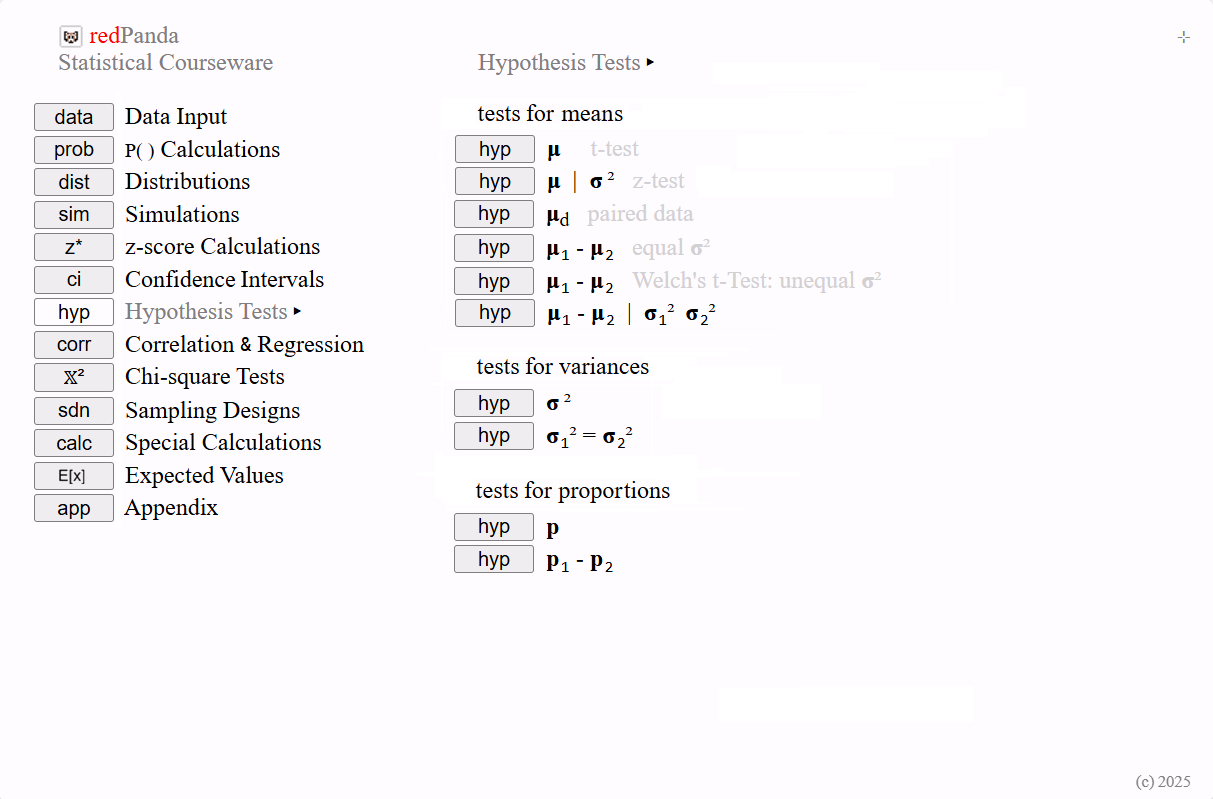
All hypothesis tests commonly introduced in an introductory statistics course are available within this submenu.
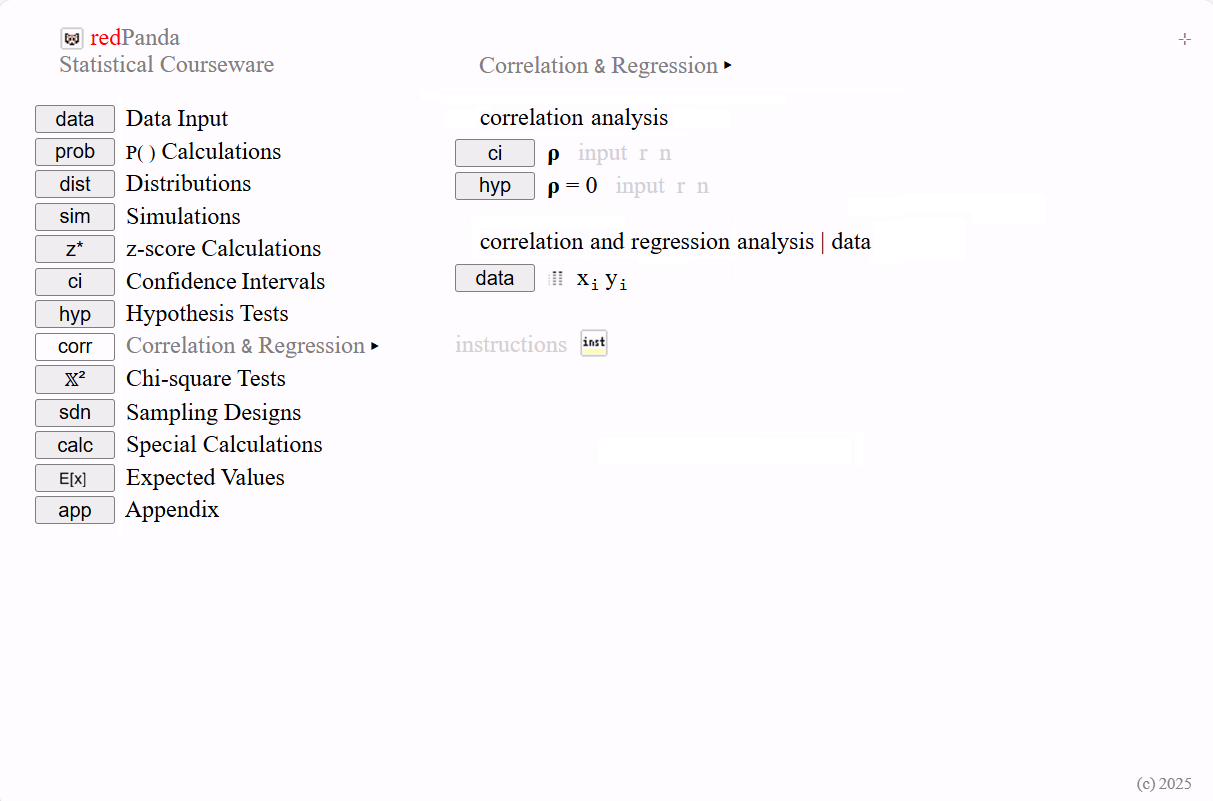
Given a predefined sample correlation and sample size, this section provides procedures for computing confidence intervals and conducting hypothesis tests on Pearson’s correlation coefficients.
Students may also enter their own XY data to run the same analyses or perform simple linear regression analysis. Selecting the instruction icon at the bottom of the submenu guides users through the process.
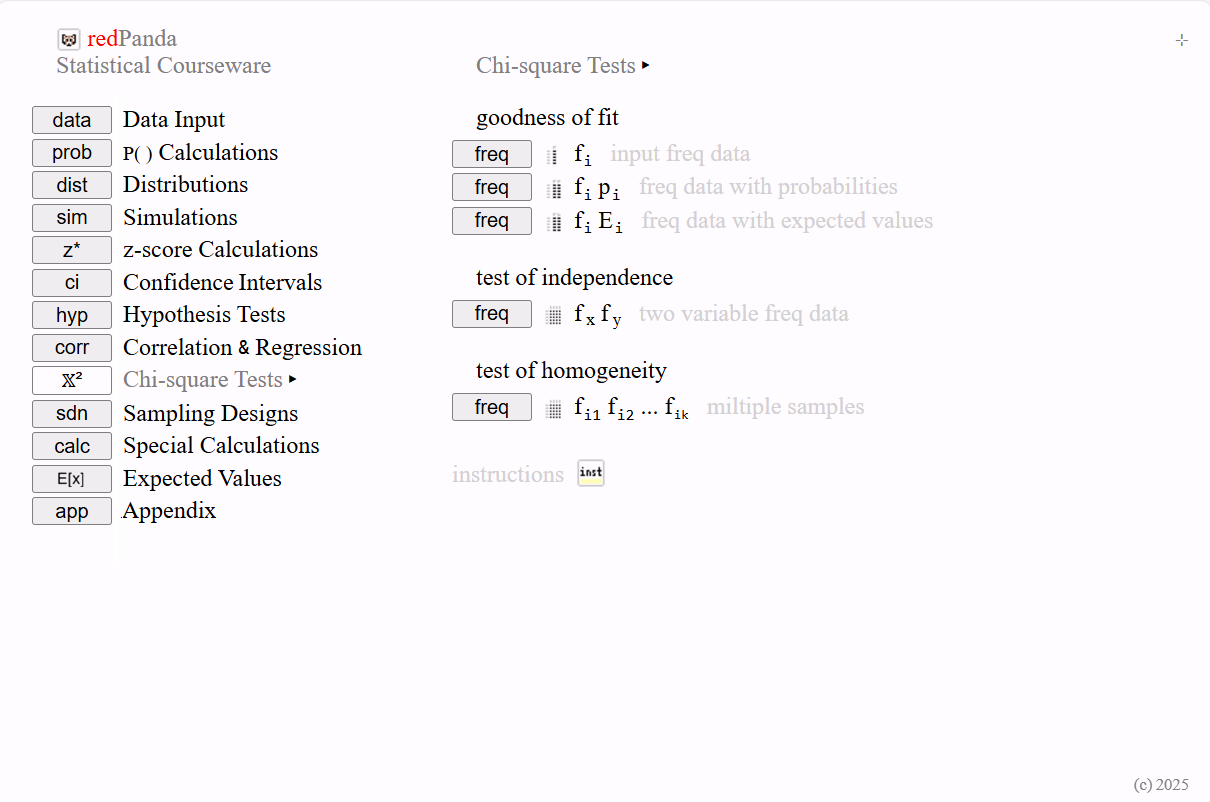
The chi‑square goodness‑of‑fit test, test of independence, and test of homogeneity are all available in this section. Each test is integrated within frequency‑based input procedures, which provide the data structure required for the corresponding analysis.
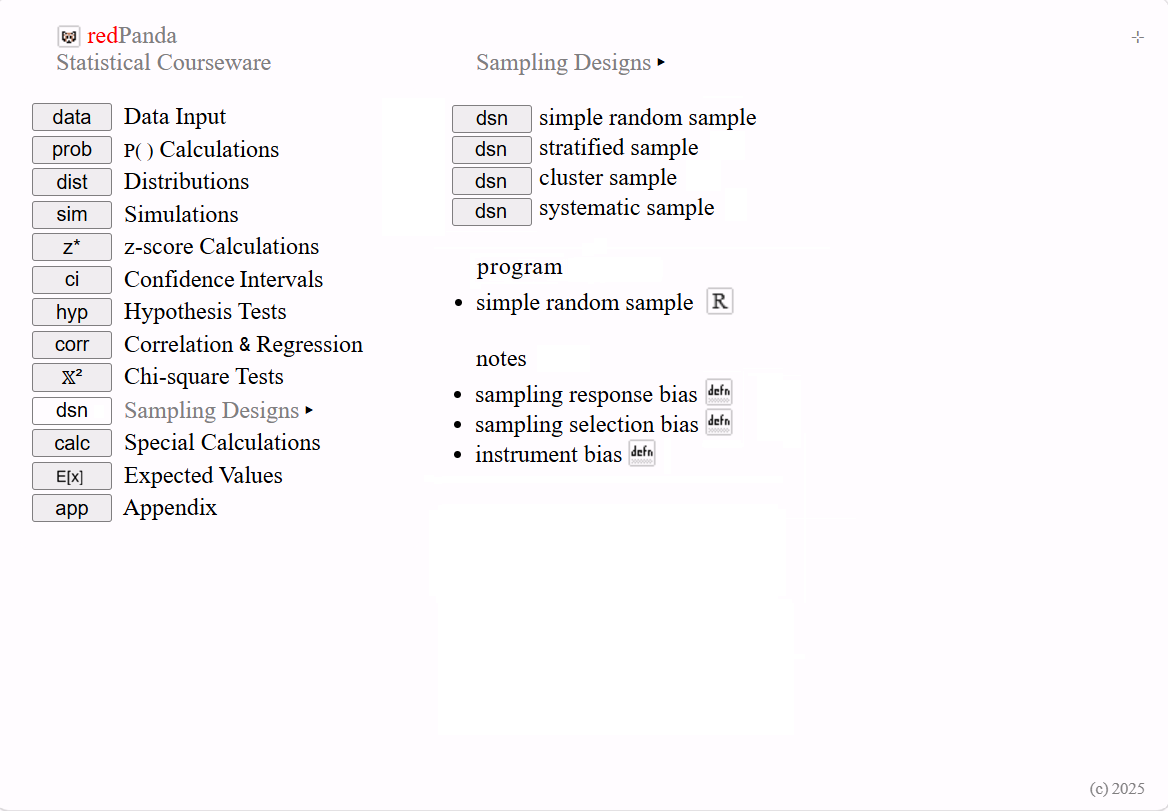
This submenu provides students with access to information screens covering all single‑stage sampling designs.
It also includes R code for generating a simple random sample, along with notes on common sources of sampling bias.
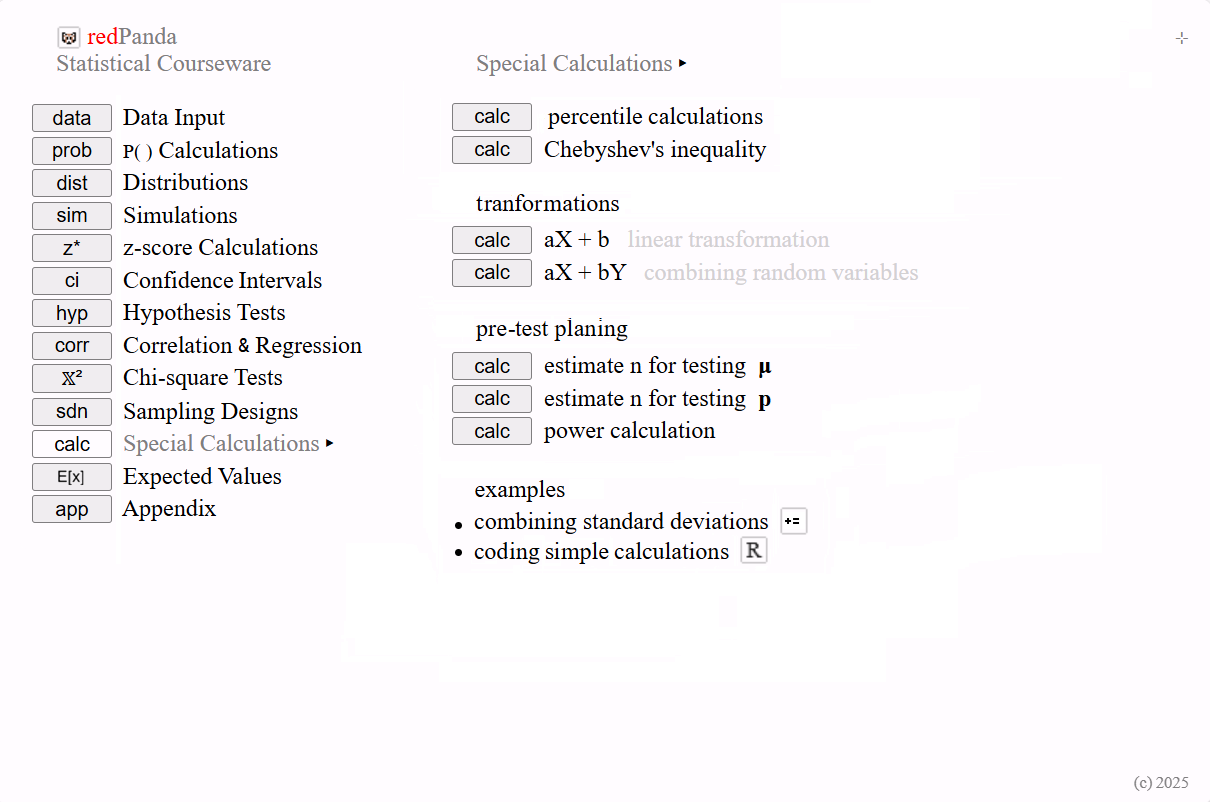
A brief set of special‑case calculations can be accessed within this submenu.
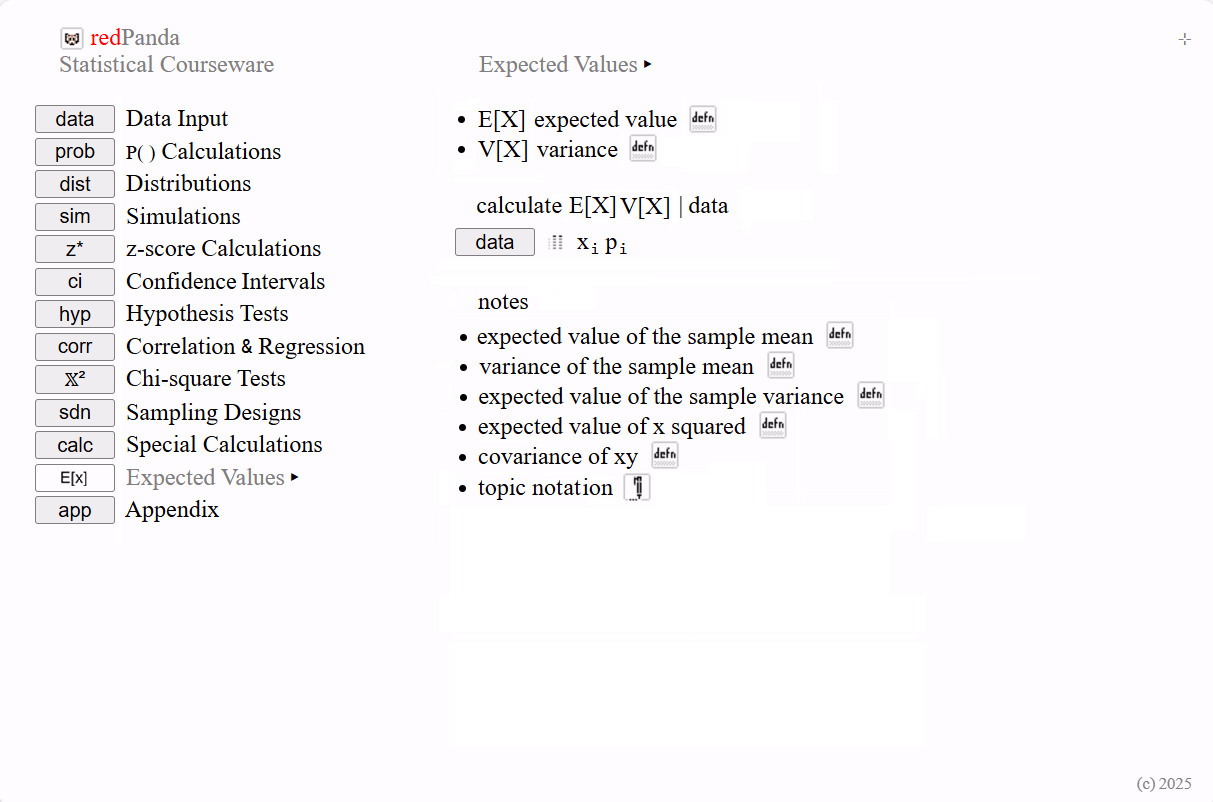
Expected value and variance operators are introduced in this submenu.
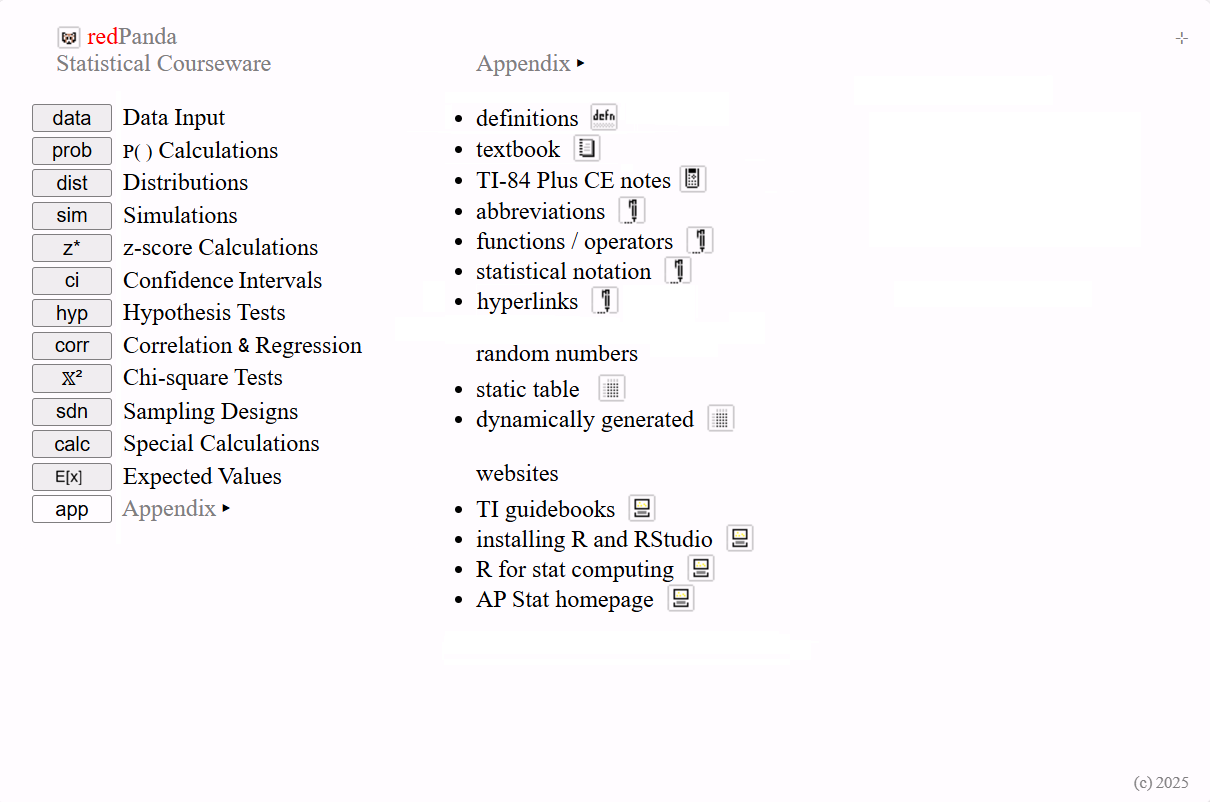
This section serves as the courseware’s appendix and includes several online resource websites.
It is important for students to become comfortable with statistical terminology. Within this section, they will find embedded notes on common abbreviations, functions and operators, standard statistical notation, and definitions.